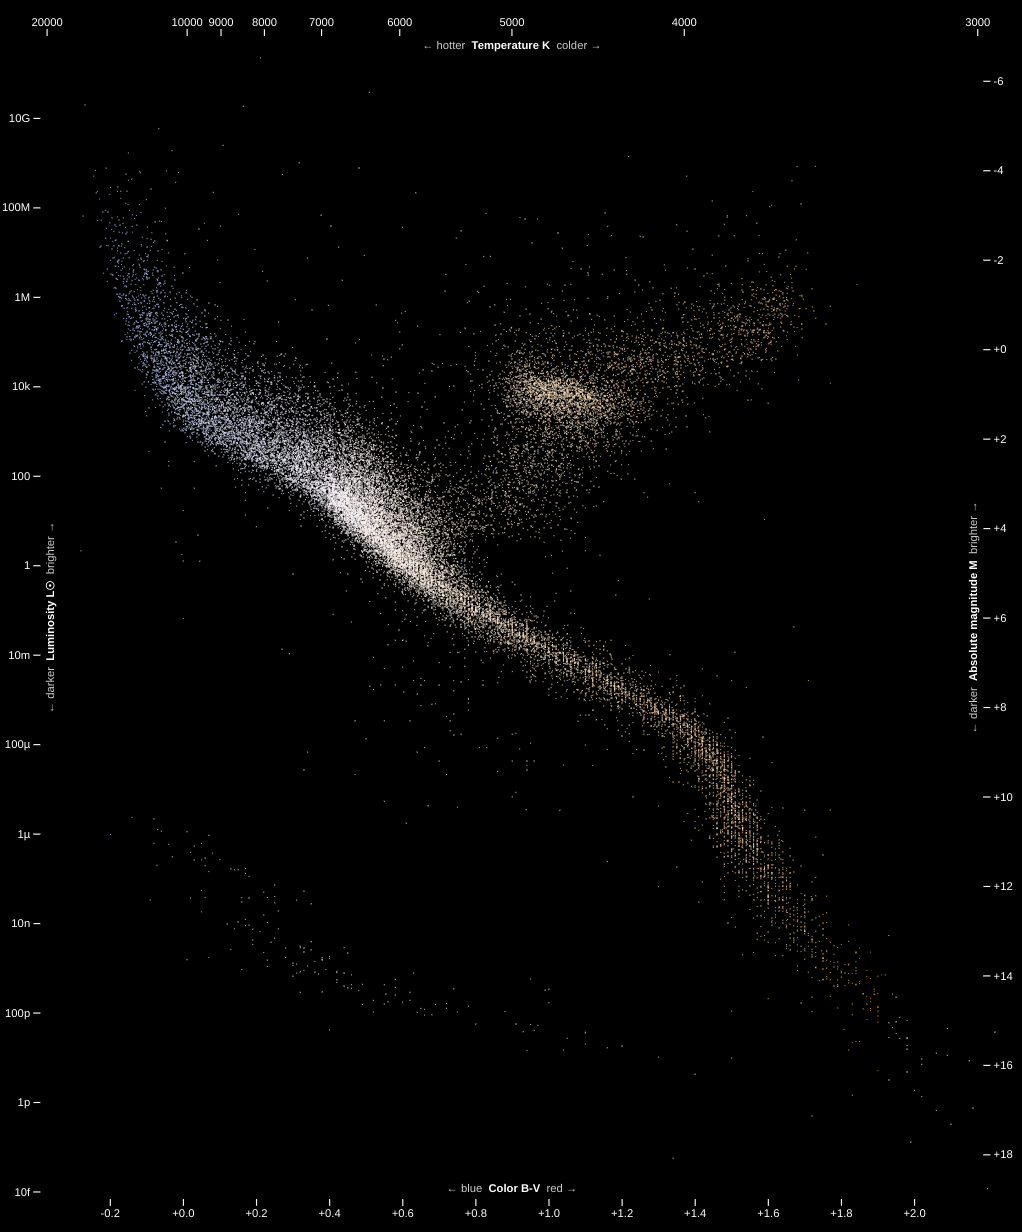
Hertzsprung Russell Diagram
Prepare data
# Source : https://observablehq.com/@d3/hertzsprung-russell-diagram
from collections import namedtuple
import detroit as d3
import polars as pl
from math import hypot

URL = (
    "https://static.observableusercontent.com/files/a01b08636a1314e9dc329d141684564156c"
    "b49190d762542f3b8d09a20f7c3275fe0be93d2ed6f9056af7b27708ed91037b729cf12263e63c0eb9"
    "8abd43702fc?response-content-disposition=attachment%3Bfilename*%3DUTF-8%27%27catal"
    "og.csv"
)
Margin = namedtuple("Margin", ["top", "right", "bottom", "left"])
catalog = pl.read_csv(URL)

Row = namedtuple("Row", catalog.columns)
data = [Row(*row) for row in catalog.iter_rows()]

# Declare the chart dimensions and margins.
width = 928
height = round(width * 1.2)
margin = Margin(40, 40, 40, 50)


def bv2rgb(bv):
    bv = max(-0.4, min(2, bv))
    t = None
    a = None
    b = None
    c = None
    if bv < 0:
        t = (bv + 0.4) / 0.4
        a = 0.61 + (0.11 * t) + (0.1 * t * t)
    elif bv < 0.4:
        t = bv / 0.4
        a = 0.83 + (0.17 * t)
    else:
        t = (bv - 1.6) / 0.4
        a = 1

    if bv < 0:
        t = (bv + 0.4) / 0.4
        b = 0.70 + (0.07 * t) + (0.1 * t * t)
    elif bv < 0.4:
        t = bv / 0.4
        b = 0.87 + (0.11 * t)
    elif bv < 1.6:
        t = (bv - 0.4) / 1.20
        b = 0.98 - (0.16 * t)
    else:
        t = (bv - 1.6) / 0.4
        b = 0.82 - (0.5 * t * t)

    if bv < 0.4:
        c = 1
    elif bv < 1.5:
        t = (bv - 0.4) / 1.1
        c = 1 - (0.47 * t) + (0.1 * t * t)
    elif bv < 1.94:
        t = (bv - 1.5) / 0.44
        c = 0.63 - (0.6 * t * t)
    else:
        c = 0

    result = "".join(map(lambda t: hex(round(t * 255))[2:], (a, b, c)))
    return f"#{result}"


def color(temperature):
    u = 8464 / temperature
    return (u - 2.1344 + hypot(0.9936, u)) / 1.6928


def temperature(color):
    return 4600 * (1 / (0.92 * color + 1.7) + 1 / (0.92 * color + 0.62))
shape: (28_967, 2)
┌────────────────────┬───────┐
│ absolute_magnitude ┆ color │
│ ---                ┆ ---   │
│ f64                ┆ f64   │
╞════════════════════╪═══════╡
│ 5.99723            ┆ 0.999 │
│ 5.867219           ┆ 0.74  │
│ 3.872542           ┆ 0.489 │
│ -0.295278          ┆ 0.955 │
│ 3.695502           ┆ 0.516 │
│ …                  ┆ …     │
│ 5.4                ┆ 1.06  │
│ 9.4                ┆ 0.94  │
│ 5.31               ┆ 0.67  │
│ 13.59              ┆ 0.07  │
│ 8.55               ┆ 1.39  │
└────────────────────┴───────┘
Make the Hertzsprung Russell Diagram
# Create the scales.
x = d3.scale_linear([-0.39, 2.19], [margin.left, width - margin.right])
y = d3.scale_linear([-7, 19], [margin.top, height - margin.bottom])
z = bv2rgb

# Create the SVG container.
svg = (
    d3.create("svg")
    .attr("width", width + 28)
    .attr("height", height)
    .attr("viewBox", [-14, 0, width + 28, height])
    .attr("style", "max-width: calc(100% + 28px) height: auto;")
    .style("margin", "0 -14px")
    .style("background", "#000")
    .style("color", "#fff")
    .style("display", "block")
    .attr("fill", "currentColor")
    .attr("font-family", "sans-serif")
    .attr("font-size", 10)
)

# Create a small (sub pixel) rectangle for each star.
(
    svg.append("g")
    .select_all("rect")
    .data(data)
    .join("rect")
    .attr("x", lambda d: x(d.color))
    .attr("y", lambda d: y(d.absolute_magnitude))
    .attr("fill", lambda d: z(d.color))
    .attr("width", 0.75)
    .attr("height", 0.75)
)

# Create the axes.
(
    svg.append("g")
    .attr("transform", f"translate({margin.left}, 0)")
    .call(
        d3.axis_left(
            d3.scale_log(map(lambda m: 10 ** (4.83 - m), y.get_domain()), y.get_range())
        )
    )
)

(
    svg.append("g")
    .attr("transform", f"translate({width - margin.right}, 0)")
    .call(d3.axis_right(y).set_ticks(None, "+"))
)

(
    svg.append("g")
    .attr("transform", f"translate(0, {height - margin.bottom})")
    .call(d3.axis_bottom(x).set_ticks(None, "+f"))
)

def top_axis(temperatures):
    tick_values = list(map(color, temperatures))
    return (
        d3.axis_top(x)
        .set_tick_values(list(map(color, temperatures)))
        .set_tick_format(lambda d: str(temperatures[tick_values.index(d)]))
    )

(
    svg.append("g")
    .attr("transform", f"translate(0, {margin.top})")
    .call(top_axis(list(range(3_000, 10_001, 1_000)) + [20_000]))
)

svg.select_all(".domain").remove()

(
    svg.append("text")
    .attr("dy", 12)
    .attr("text-anchor", "middle")
    .attr(
        "transform",
        f"translate({margin.left},{(margin.top + height - margin.bottom) / 2}) rotate(-90)",
    )
    .call(
        lambda text: text.append("tspan").attr("fill-opacity", 0.8).text("← darker\xa0")
    )
    .call(
        lambda text: text.append("tspan")
        .attr("font-weight", "bold")
        .text("\xa0Luminosity L☉\xa0")
    )
    .call(
        lambda text: text.append("tspan")
        .attr("fill-opacity", 0.8)
        .text("\xa0brighter →")
    )
)

(
    svg.append("text")
    .attr("dy", -6)
    .attr("text-anchor", "middle")
    .attr(
        "transform",
        f"translate({width - margin.right},{(margin.top + height - margin.bottom) / 2}) rotate(-90)",
    )
    .call(
        lambda text: text.append("tspan").attr("fill-opacity", 0.8).text("← darker\xa0")
    )
    .call(
        lambda text: text.append("tspan")
        .attr("font-weight", "bold")
        .text("\xa0Absolute magnitude M\xa0")
    )
    .call(
        lambda text: text.append("tspan")
        .attr("fill-opacity", 0.8)
        .text("\xa0brighter →")
    )
)

(
    svg.append("text")
    .attr("x", (margin.left + width - margin.right) / 2)
    .attr("y", margin.top)
    .attr("dy", 12)
    .attr("text-anchor", "middle")
    .call(
        lambda text: text.append("tspan").attr("fill-opacity", 0.8).text("← hotter\xa0")
    )
    .call(
        lambda text: text.append("tspan")
        .attr("font-weight", "bold")
        .text("\xa0Temperature K\xa0")
    )
    .call(
        lambda text: text.append("tspan").attr("fill-opacity", 0.8).text("\xa0colder →")
    )
)

(
    svg.append("text")
    .attr("x", (margin.left + width - margin.right) / 2)
    .attr("y", height - margin.bottom)
    .attr("dy", -6)
    .attr("text-anchor", "middle")
    .call(
        lambda text: text.append("tspan").attr("fill-opacity", 0.8).text("← blue\xa0")
    )
    .call(
        lambda text: text.append("tspan")
        .attr("font-weight", "bold")
        .text("\xa0Color B-V\xa0")
    )
    .call(lambda text: text.append("tspan").attr("fill-opacity", 0.8).text("\xa0red →"))
)
Save your chart
with open("hertz_russel.svg", "w") as file:
    file.write(str(svg))