Detroit’s documentation!
detroit is a Python implementation of d3js.
Installation
The latest stable version is available on PyPI. Install with pip:
pip install detroit
Getting starting
detroit attempts to be as close as possible to the d3js API.
Functions and methods has been renamed to be lowercase and seperated by underscores to follow the PEP 8 conventions.
Instead of using the same method to set or get a value, most of classes has set_<property> and get_<property> methods. Here is an example:
// d3js
const scale = d3.scaleLinear().domain([0, 10]).range([0, 920]);
console.log(scale.domain()) // [0, 10]
# detroit
scale = d3.scale_linear().set_domain([0, 10]).set_range([0, 920])
print(scale.get_domain()) # [0, 10]
To create a svg content, you can start by using d3.create:
import detroit as d3
svg = d3.create("svg")
Then, you can create a scaler:
width = 960
height = 580

margin_left = 40
margin_right = 30

margin_top = 20
margin_bottom = 30

# Several signatures accepted
# d3.scale_linear()
# d3.scale_linear(range)
# d3.scale_linear(domain, range)
x = d3.scale_linear([0, 10], [margin_left, width - margin_right])

# or
x = (
  d3.scale_linear()
  .set_domain([0, 10])
  .set_range([margin_left, width - margin_right])
)

y = d3.scale_linear([0, 100], [height - margin_bottom, margin_top])
Now, you can build your own visualization given your data:
data = [
   {"quantity": 0, "ratio": 50},
   {"quantity": 1, "ratio": 12},
   {"quantity": 2, "ratio": 89},
   {"quantity": 3, "ratio": 87},
   {"quantity": 4, "ratio": 62},
   {"quantity": 5, "ratio": 8},
   {"quantity": 6, "ratio": 10},
   {"quantity": 7, "ratio": 33},
   {"quantity": 8, "ratio": 8},
   {"quantity": 9, "ratio": 23},
   {"quantity": 10, "ratio": 10},
]

# Add x axis
(
    svg.append("g")
    .attr("class", "x-axis")
    .attr("transform", f"translate(0, {height - margin_bottom})")
    .call(d3.axis_bottom(x))
)

# Add y axis
(
    svg.append("g")
    .attr("class", "y-axis")
    .attr("transform", f"translate({margin_left}, 0)")
    .call(d3.axis_left(y))
)

line = d3.line().x(lambda d: x(d["quantity"])).y(lambda d: y(d["ratio"]))

# Add line path
(
    svg.append("path")
    .attr("fill", "none")
    .attr("stroke", "steelblue")
    .attr("stroke-width", 1.5)
    .attr("d", line(data))
)
Once you have finished, you can save it to a .svg file:
with open("tuto.svg", "w") as file:
    file.write(str(svg))


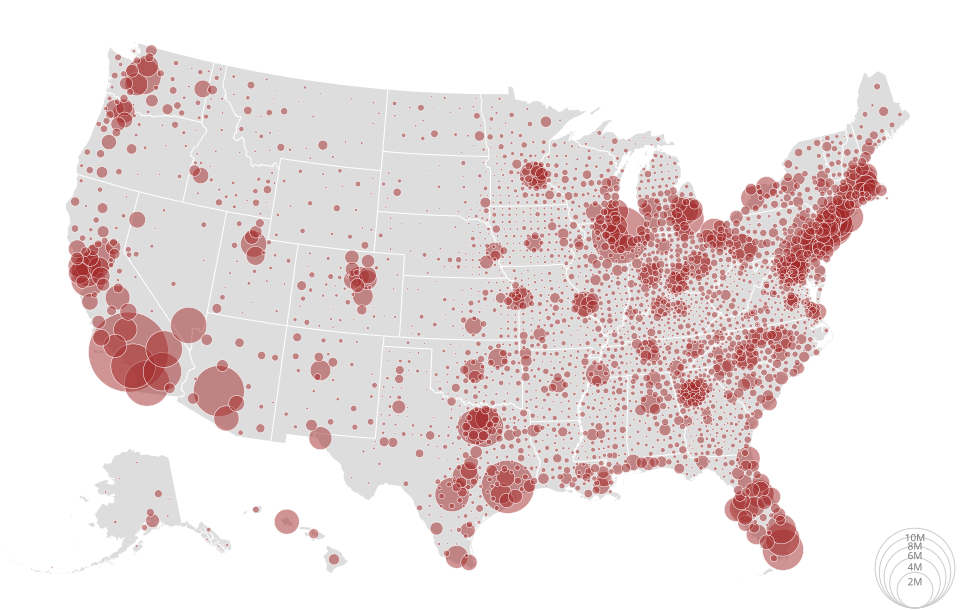
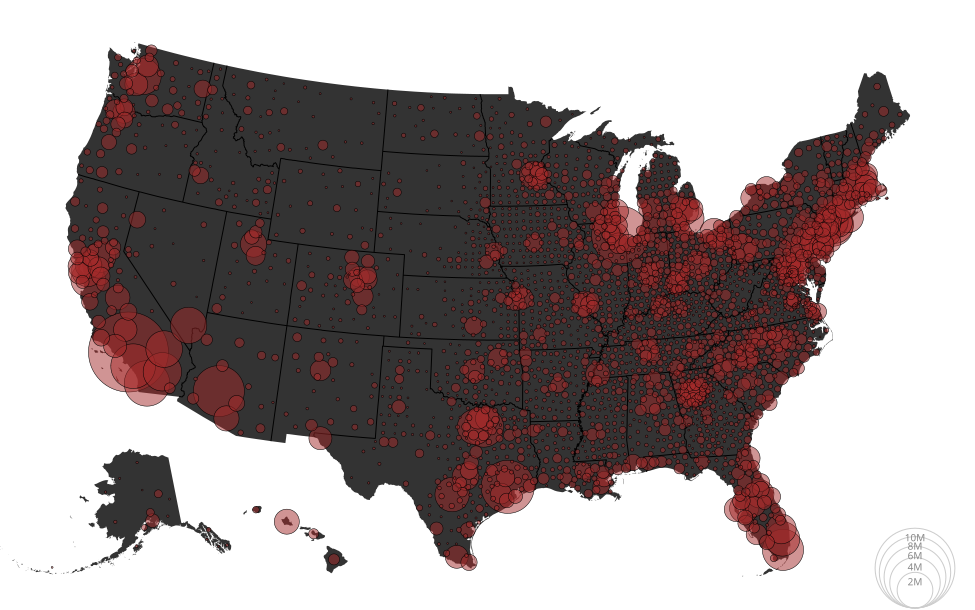
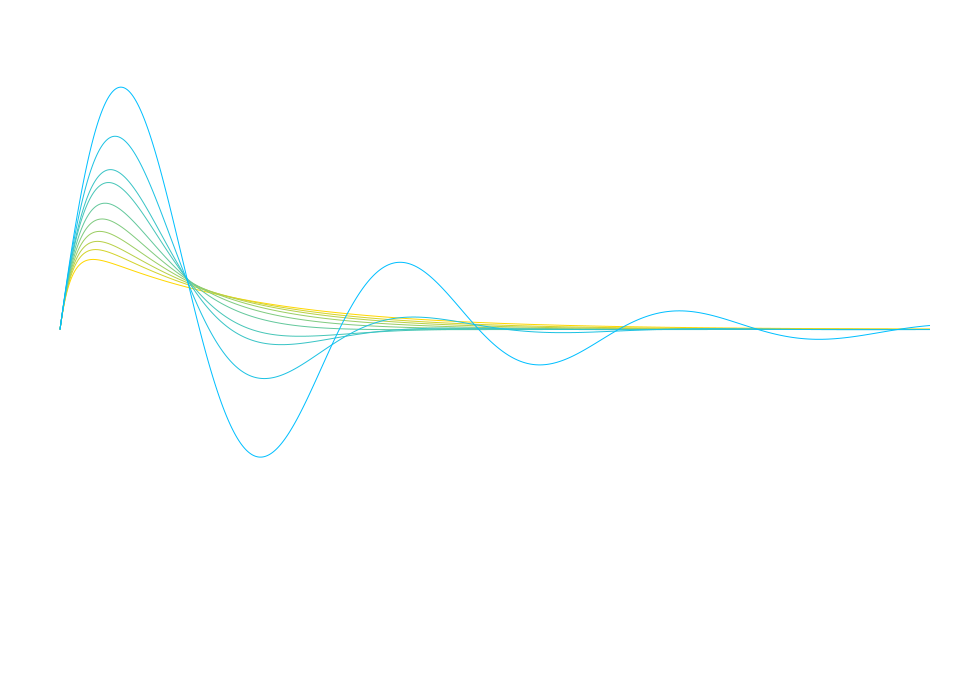
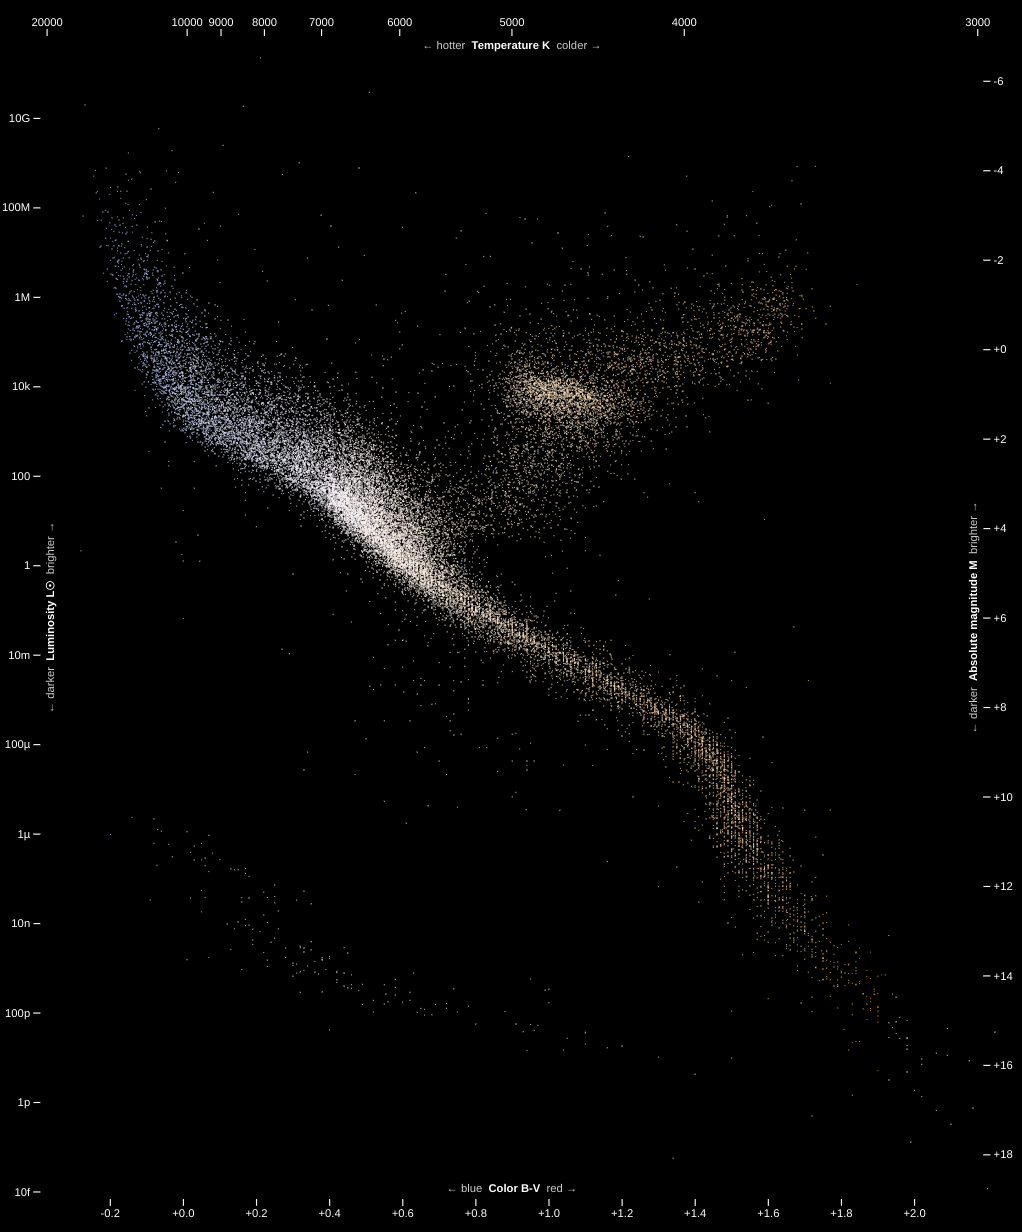
Gallery